
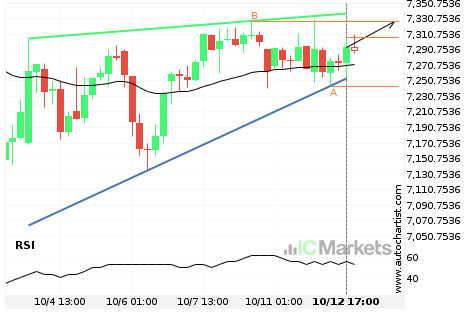
Should we expect a breakout or a rebound on Australia 200 Index?
The movement of Australia 200 Index towards the resistance line of a Rising Wedge is yet another test of the line it reached numerous times in the past. We expect this line test to happen in the next 2 days, but it is uncertain whether it will result in a breakout through this line, or […]

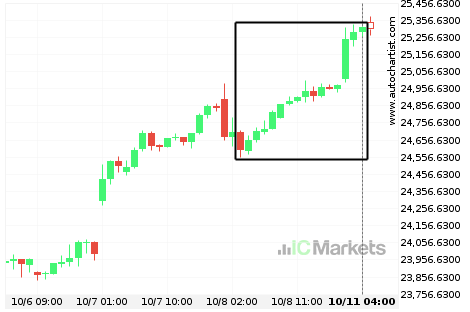
Should we expect a breakout or a rebound on Hong Kong 50 Index?
The movement of Hong Kong 50 Index towards 24858.5996 price line is yet another test of the line it reached numerous times in the past. We expect this line test to happen in the next 5 hours, but it is uncertain whether it will result in a breakout through this line, or simply rebound back […]
FTSE China A50 Index is on its way up
FTSE China A50 Index has experienced an exceptionally large amount of consecutive bullish candles. to reach a price of 15861.6600 in the last 8 days.

FTSE China A50 Index is on its way up
FTSE China A50 Index has experienced an exceptionally large amount of consecutive bullish candles. to reach a price of 15861.6600 in the last 8 days.
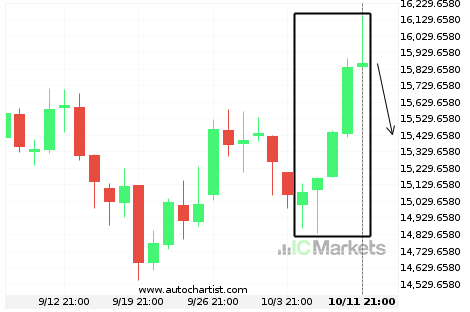
What’s going on with Hong Kong 50 Index?
Those of you that are trend followers are probably eagerly watching Hong Kong 50 Index to see if its latest 2.91% move continues. If not, the mean-reversion people out there will be delighted to cash in on this exceptionally large 4 days move.
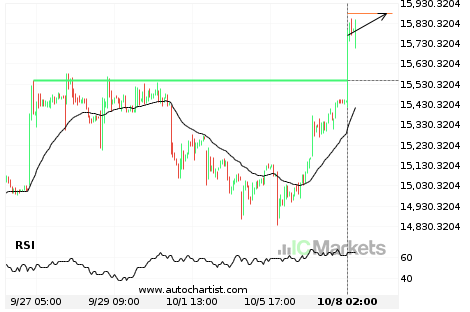
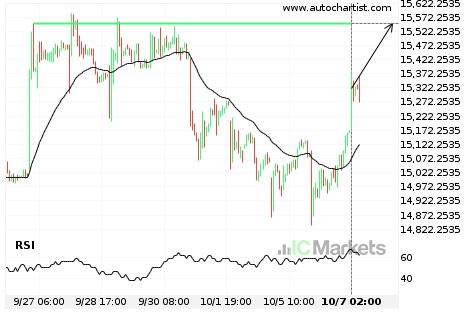
Should we expect a bullish trend on FTSE China A50 Index?
The breakout of FTSE China A50 Index through the 15548.2803 price line is a breach of an important psychological price that is has tested numerous in the past. If this breakout persists, we expect the price of FTSE China A50 Index to test 15878.2070 within the next 2 days. One should always be cautious before […]

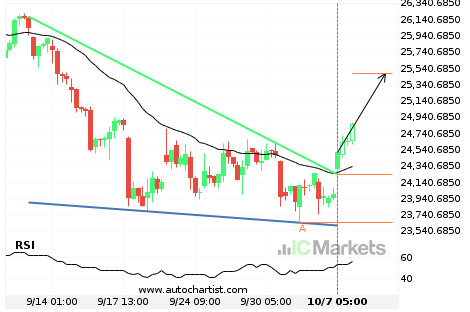
A start of a bullish trend on Hong Kong 50 Index
Hong Kong 50 Index has broken through a resistance line of a Falling Wedge chart pattern. If this breakout holds true, we expect the price of Hong Kong 50 Index to test 25471.5377 within the next 3 days. But don’t be so quick to trade, it has tested this line in the past, so you […]
Either a rebound or a breakout imminent on FTSE China A50 Index
FTSE China A50 Index is heading towards a line of 15548.2803. If this movement continues, we expect the price of FTSE China A50 Index to test 15548.2803 within the next 2 days. But don’t be so quick to trade, it has tested this line numerous times in the past, so this movement could be short-lived […]
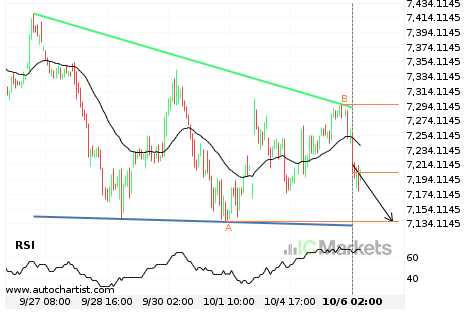
Will Australia 200 Index have enough momentum to break support?
Australia 200 Index is heading towards the support line of a Descending Triangle and could reach this point within the next 2 days. It has tested this line numerous times in the past, and this time could be no different from the past, ending in a rebound instead of a breakout. If the breakout doesn’t […]